Federally-backed student loans were paused in the early stages of 2020 in the midst of the COVID-19 pandemic, and those borrowers haven’t had to make any payments since. Others, who had a mix of federally-backed and private student loans, experienced relief from their federal loans, but continued to pay on private loans. The last segment, who had private loans only, continued to pay their loans as usual.
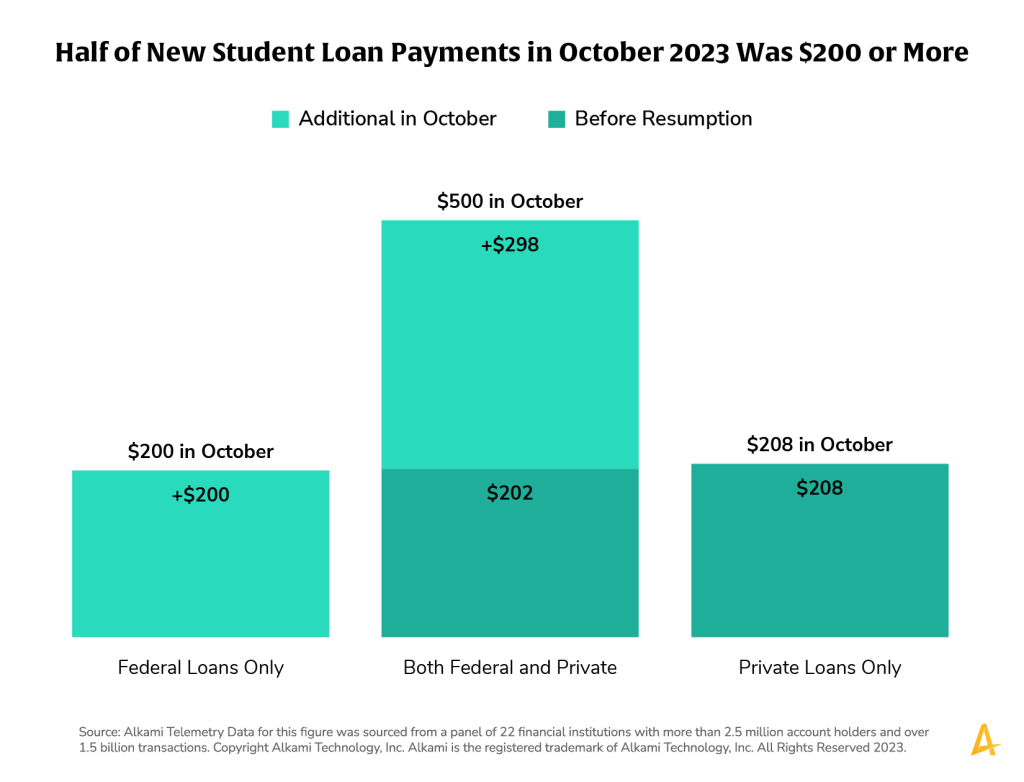
The data panel was examined to look at the additional dollar impact of resuming the federally-backed student loans in October 2023. Those who had only federally-backed student loans had a median payment of $200. Those who had both private and federally-backed loans were already paying a median of $202 for their private loans and their resumed payment on their federally-backed loan was $298. Those with only private student loans, for comparison purposes, paid a median of $208 towards those loans, but it is not a new expense.
Not all student loan borrowers are affected the same way by resumption of federally-backed loan payments. Examining the data will provide an understanding of the three cohorts of student loan borrowers to where a financial institution can address the unique needs of each.
Source: Alkami Telemetry Data for this figure was sourced from a panel of 22 financial institutions with more than 2.5 million account holders and over 1.5 billion transactions.
